Analysis
Check back here from time to time for analyses of important issues.
As of the end of January 2025: 153+ million commercial and backyard birds dead from H5N1 morbidity or culling
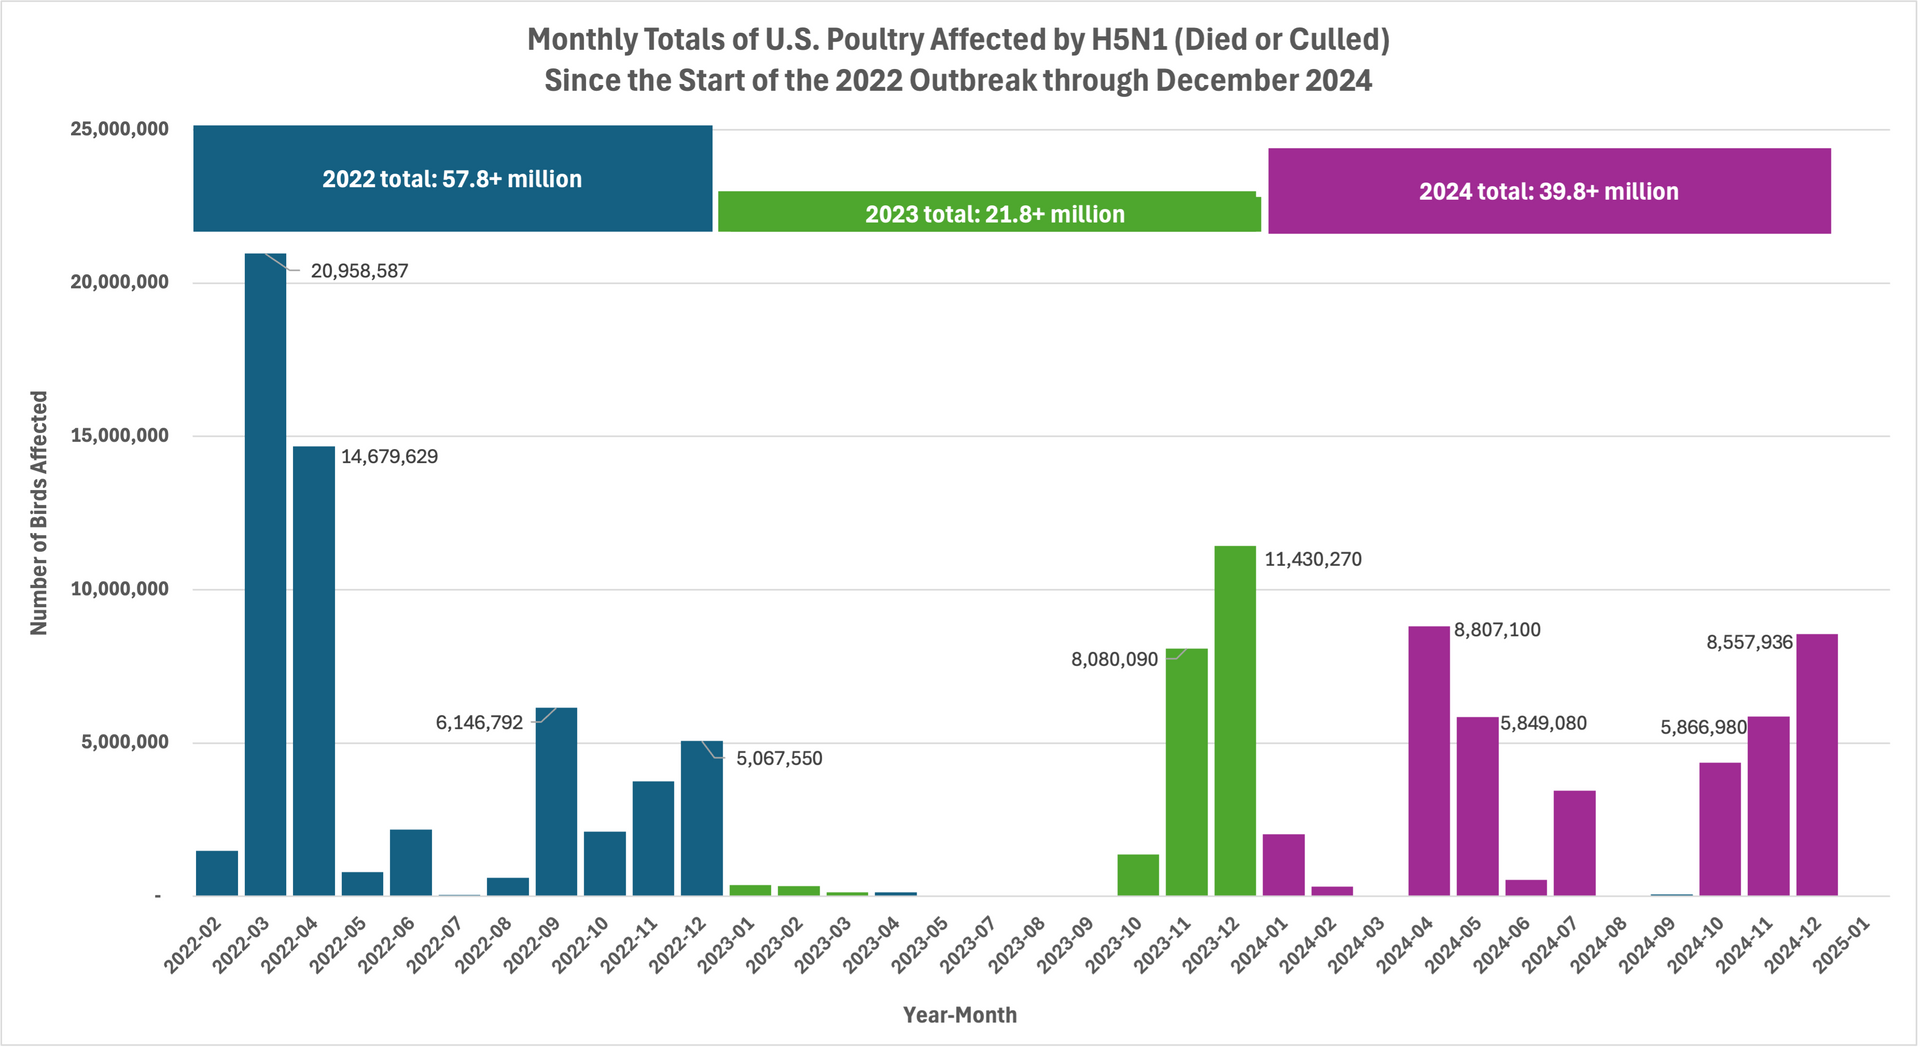
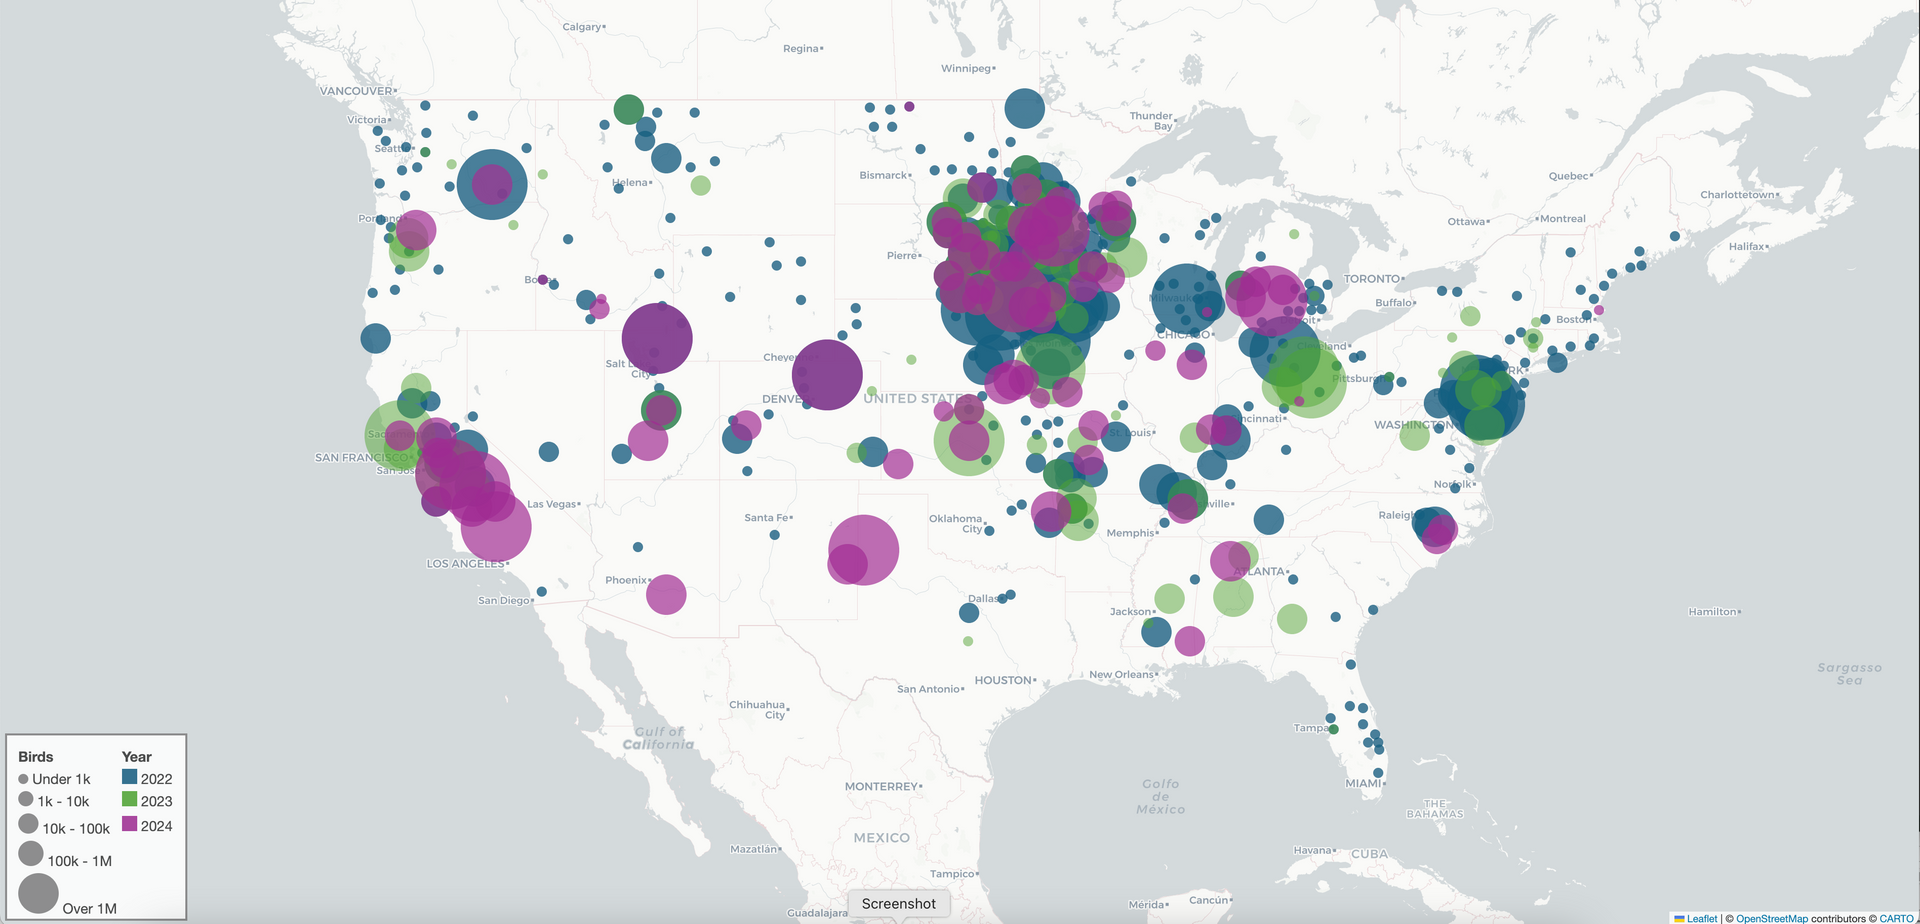
Below is an update to our analysis from last summer. We've graphed and mapped the outbreak depopulation events in poultry from the inception of the outbreak through December 2024 using USDA APHIS data (here). The graph shows how much worse 2024 was than 2023 in terms of absolute numbers year-over-year, and the map reveals its wide geographic footprint.
We calculate 119+ million birds affected through 2024. This does not account for the surge in cases beginning in 2025: January has seen a heavy burden, and APHIS is now reporting a total of more than 153 million animals affected.


Map courtesy Brice Hutchings.
As of July 2024: 99+ million commercial and backyard birds dead from H5N1 morbidity or culling
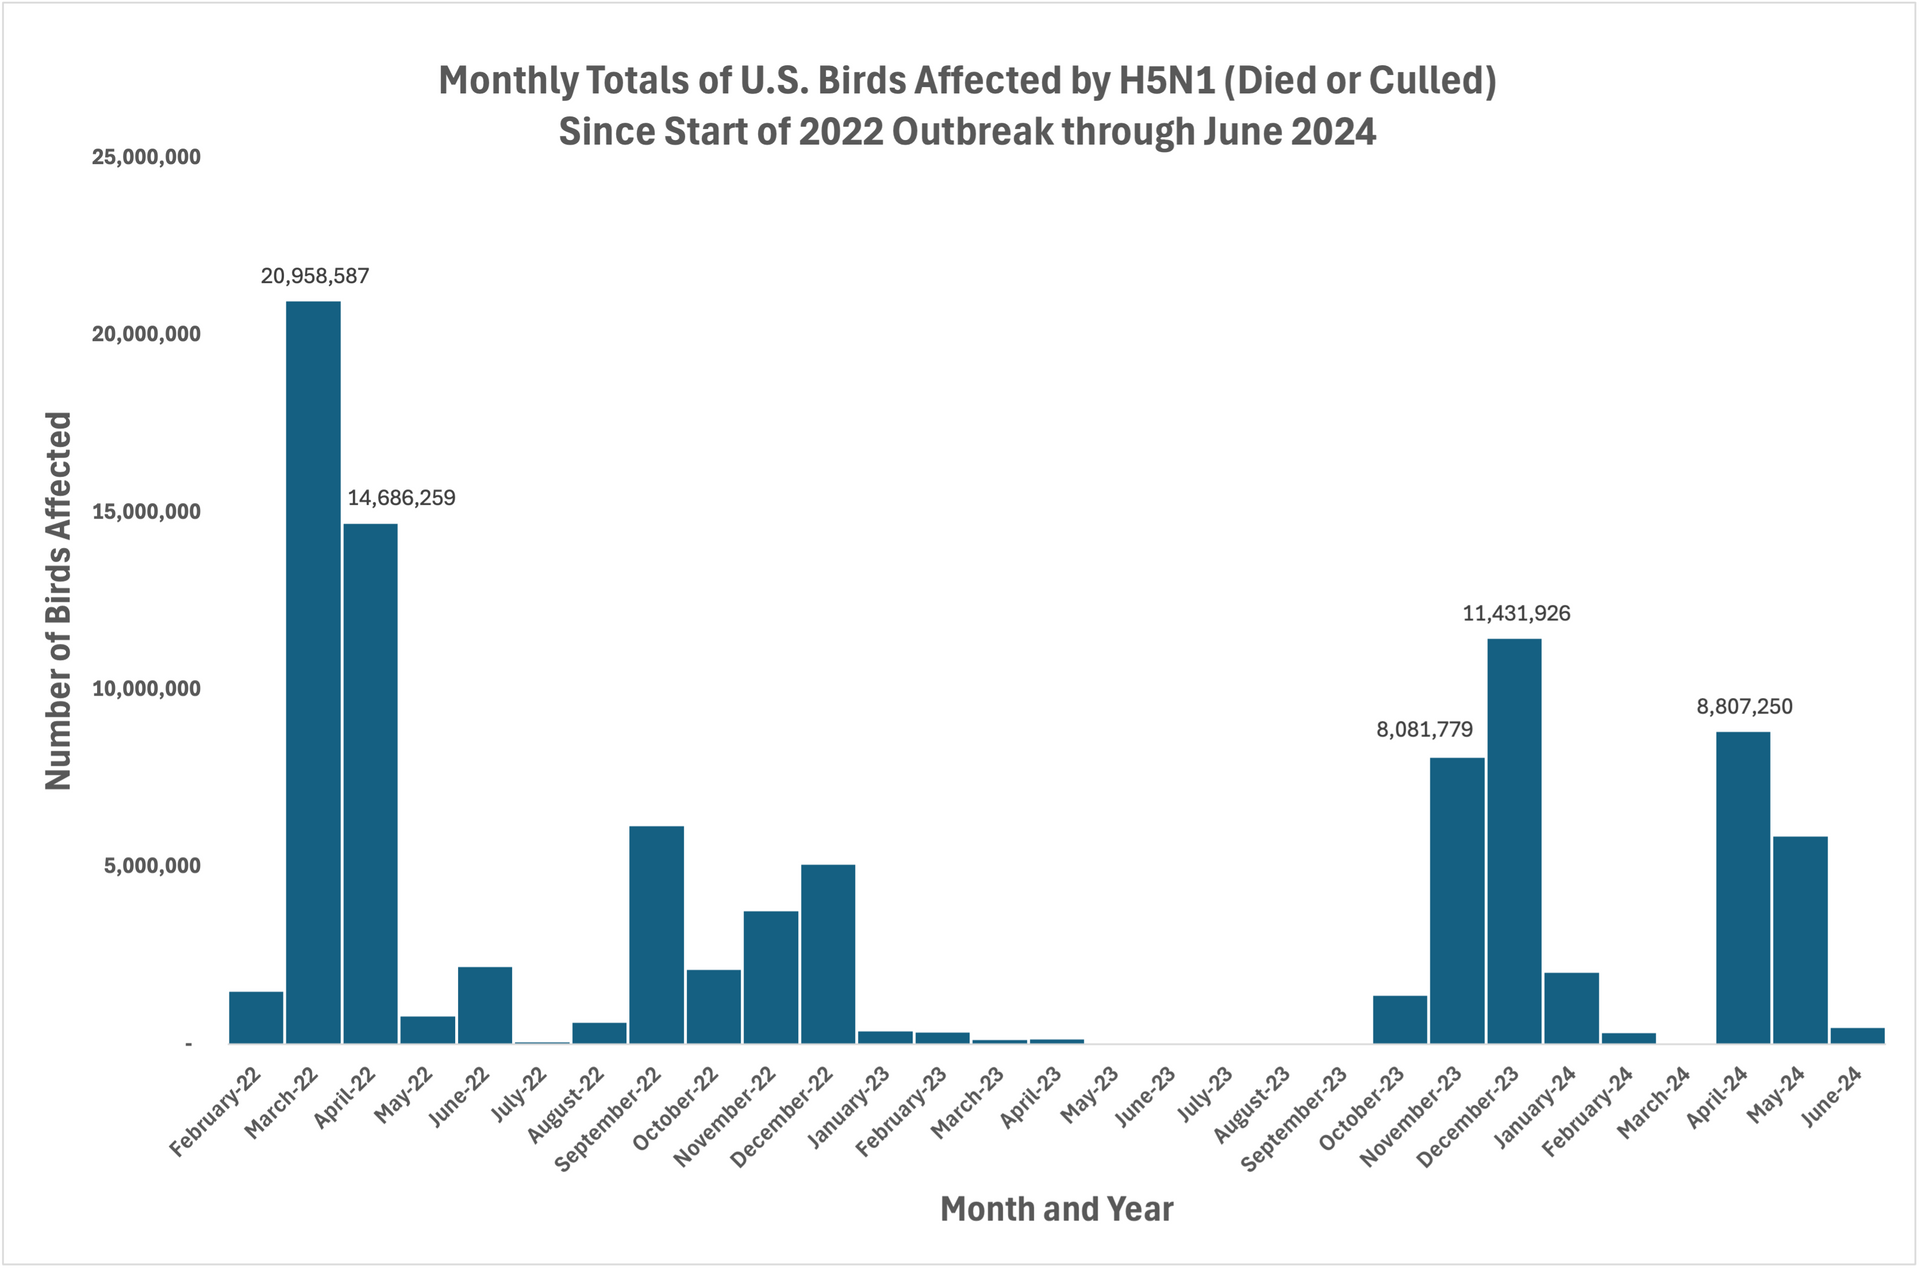
As highly pathogenic avian influenza rages in the United States, understanding not only how to stop it but what it is telling us about our society is increasingly important. The U.S. Department of Agriculture publishes data on confirmed cases in animals here. The data are presented in a format extremely challenging to digest. We worked to clean the data on confirmed cases in poultry farms and charted them to reveal the patterns of the outbreak over time.
The graph shows a predominantly seasonal pattern, with relative quiet in summer. It also shows that the culling approach is not working. USDA does not parse the number of dead birds by those that died naturally and those that were culled as part of the government's stamping out directive. We can assume that most were culled. The graph reveals that of the five worst months in the outbreak to date, three of them were recent. We are do not believe that the USDA has ever presented the data in these way. Understanding the extent and patterns of the cullings will help us better understand whether it is actually working, and hopefully force us to think about whether this is the way we want to live with animals and our shared environment.

Special thanks to Brice Hutchings for data cleaning and coding.

